Sell Your Online Business With Flippa
Access expert guidance and the technology you need to list, market and close your deal.
Whether you’re developing your own app or thinking about buying or selling one, understanding app performance is essential. A strong-performing app doesn’t just attract users. It retains them, generates revenue, and builds trust. And if you’re listing an app for sale on a platform like Flippa, being able to show real, verified performance data can make all the difference.
In this guide, you’ll learn the five most important metrics that reveal how an app is performing. You’ll also find practical tips on how to present this data clearly to potential buyers.
Key Takeaways
- App performance is measured by metrics like conversion rate, crash rate, ratings, category rank, and competitive benchmarks.
- Verified analytics build trust and help app sellers stand out on Flippa.
- Tools like data.ai, Flurry, and Firebase help track and present performance clearly.
- Buyers should always ask for data before purchasing an app.
- Sellers should prepare reports, walkthroughs, or video calls to showcase value.
What Is App Performance and Why Is It Important?
App performance is a broad term that covers how well your app functions, how users interact with it, and how it stacks up against others in the app marketplace. It includes everything from technical stability to user engagement, download trends, and revenue generation.
Strong app performance means your app is running smoothly, users are happy, and your metrics are heading in the right direction. Poor performance, on the other hand, can show up as crashes, low ratings, high uninstall rates, or slow growth.
Why does it matter? Because performance affects everything—user trust, visibility in app stores, and your ability to grow or sell the app. If you’re a developer, good performance helps with retention and monetization. If you’re a seller, it gives buyers confidence in the app’s value. And if you’re a buyer, it helps you spot strong investments and avoid risky ones.
Tracking and understanding app performance is the foundation for making smart decisions, whether you’re building, buying, or selling.
The 5 Key Metrics That Define App Performance
To truly understand how an app is performing, you need to go beyond surface-level impressions. Whether you’re analyzing your own app or evaluating one to buy, these five core metrics will give you a clear, data-backed view of its health, user experience, and growth potential.
Each one tells a different part of the story, and together they help you make more informed decisions. Let’s break them down.
1. Conversion Rate
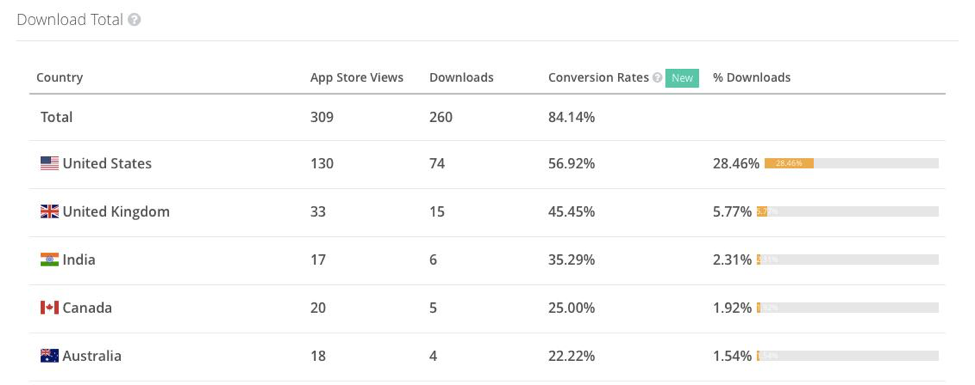
Conversion rate is one of the most important indicators of app performance. It tells you how often people who view your app’s store page actually go on to download it. A higher rate means your store page is convincing users to take action. According to AppTweak, the average conversion rate in the U.S. App Store is 25%, while Google Play comes in slightly higher at 27.3%.
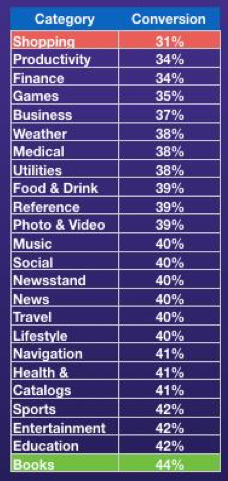
Conversion rates vary by app category. For example, Book apps tend to convert around 44 percent of visitors, while Shopping apps are closer to 31 percent. That difference matters when evaluating how competitive your category is.
If you’re looking to improve your app’s conversion rate, here are a few proven tactics:
- Update your app’s store metadata to better reflect its value
- Understand your target audience and speak directly to their needs
- Promote the app through the right channels for your demographiKeep an eye on ratings and reviews, since they heavily influence user decisions
2. App Stability
No one wants to use an app that crashes. If your app isn’t stable, users will drop off quickly and leave negative reviews. That hurts your overall rating and reduces your chances of attracting new users.
To measure this part of your app’s performance, look at both crash analytics and user feedback. Search your app reviews for keywords like “bug,” “crash,” or “glitch,” and track how often those come up. Tools like iOS App Analytics and Google Play’s developer console also give you direct reports on crash frequency.
If you’re preparing your app for sale, having clean data on crash rates shows buyers that you’re on top of quality and user experience.
3. Average Rating
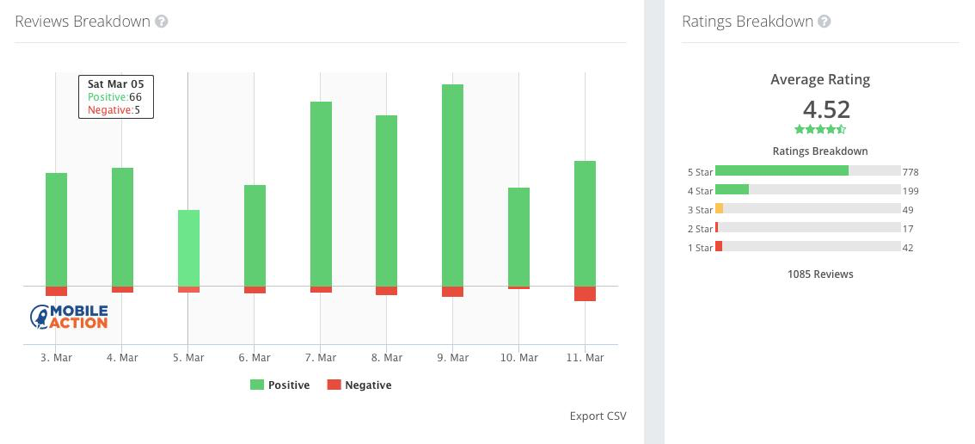
An app’s average rating is one of the first things users notice. It’s a simple number, but it says a lot about overall app performance. A high rating usually means your app is delivering on what it promises. A low rating might be a sign that users are running into bugs, poor design, or missing features.
Pay close attention to the reviews behind the numbers to improve your rating. Look for patterns in the feedback and address the issues users are highlighting. Regular updates, quick bug fixes, and thoughtful responses to reviews can go a long way in turning things around.
Buyers also look at ratings to evaluate quality and risk, so this metric is key when listing your app for sale.
4. Category Ranking
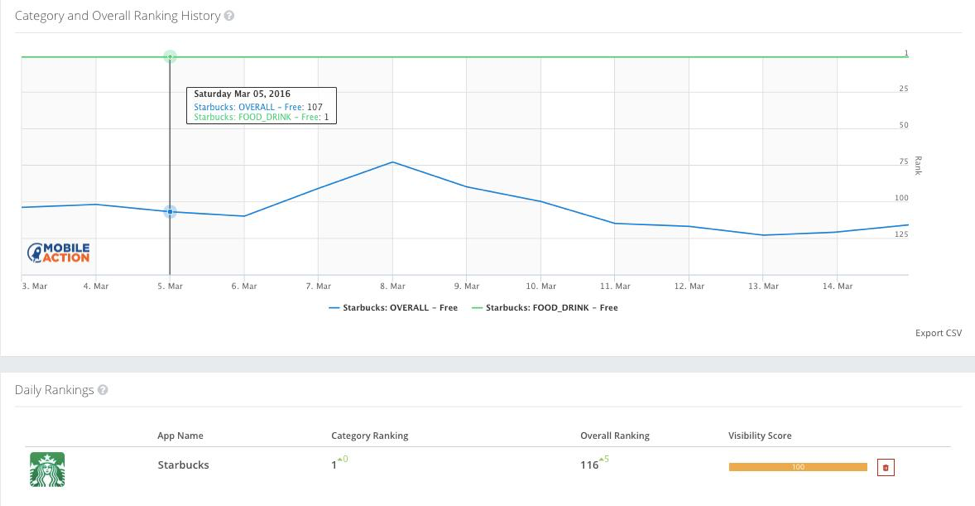
Category ranking reflects how your app stacks up against others in its niche based on downloads, engagement, retention, and reviews. In 2022, non‑game iPhone apps in the U.S. needed about 156,000 daily installs to reach the number one spot — a 37% jump from 2019.
Apps that break into the top 10 of their category usually see a boost in performance across the board. Even moving up a few spots can lead to more downloads and better discoverability.
Keeping track of your ranking helps you understand how well your app is performing in a competitive space. It’s also a useful talking point for buyers wanting to see potential growth.
5. Competitive Benchmarks
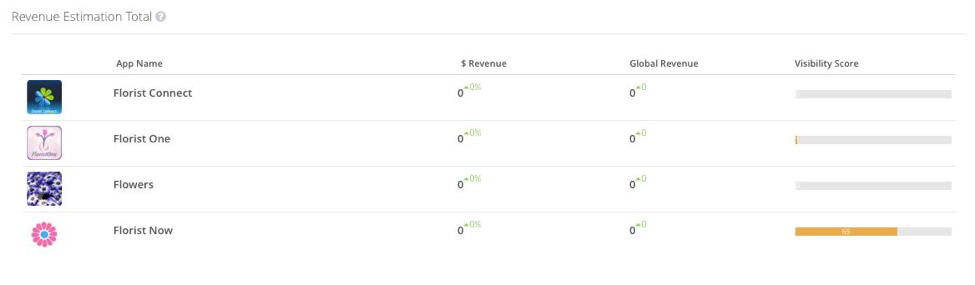
To truly understand app performance, it helps to look beyond your own data. Comparing your downloads and revenue to similar apps gives you valuable context. It can show where you’re ahead, where you’re falling behind, and what your realistic growth potential looks like.
Tools like data.ai (formerly App Annie) and Sensor Tower let you analyze competitor downloads, revenue, user locations, and more. This kind of benchmarking helps you understand your app’s performance in the broader market and shows buyers how you stack up.
If you’re selling your app, buyers will often ask how it compares to others in the space. Having this data ready shows that you’ve done your homework and helps justify your valuation.
Verifying App Performance for Buyers
If you’re planning to sell your app, it’s not enough to say it performs well. Buyers want to see real, verifiable data. Including accurate performance metrics in your listing builds trust and saves time for everyone involved.
There are several tools that can help you gather and present this data:
- Flurry: Free to use and trusted globally for mobile app analytics
- Data.ai: Offers both free and paid plans with powerful competitive insights
- Google Analytics for Mobile: Great for Android apps, especially with Google Play integration
- iOS App Analytics: Built into Apple’s developer tools and requires no extra setup
Using these tools, you can collect and display the numbers that matter most to buyers.
How to Share Your App Performance with Buyers
Once you’ve gathered your performance data, the next step is making sure buyers can easily see and understand it. Here are three simple ways to present your app’s performance:
- Video Walkthrough: Record a quick screen share showing your analytics dashboard and key data points
- Screenshots and PDFs: Take clear screenshots or export reports from your analytics tools and upload them as attachments to your listing
- Live Call: Offer to jump on a short video call with serious buyers to walk through the data together
Being transparent and proactive with your performance metrics increases confidence and can help you close deals faster.
Final Thoughts
Understanding and presenting app performance is essential whether you’re growing an app, listing it for sale, or considering a purchase. Focusing on the right metrics, like conversion rates, stability, ratings, and rankings, will give you a much clearer picture of how an app is really doing.
If you’re selling, verified performance data makes your listing stand out and helps serious buyers move forward with confidence. If you’re buying, asking for this data ensures you’re making an informed decision.
Flippa is home to one of the largest marketplaces for apps, with active buyers, smart tools, and flexible ways to showcase performance. Whether you’re ready to list or still evaluating your options, tracking the right metrics is a smart place to start.
FAQs
What is app performance?
App performance refers to how well an app functions and engages users. Key factors include download rates, user retention, stability, ratings, and revenue.
How do I know if an app is performing well?
Look at its conversion rate, number of crashes, average rating, category ranking, and how it compares to similar apps. These metrics give you a complete picture.
What tools can I use to track app performance?
Popular options include Flurry, App Annie, Google Analytics for Mobile, and iOS App Analytics. Each offers insights into different parts of your app’s performance.
Should I include performance data when selling my app?
Yes. Providing verified performance data increases buyer confidence and helps you get fair offers. It also speeds up negotiations and builds trust.
Can I list my app on Flippa without showing performance data?
You can, but including performance data is highly recommended. It makes your listing more competitive and gives buyers the details they need to move forward.

Christine Beuhler is the Content Marketing Manager at Mobile Action. She writes about simple steps you can take to understand and improve your app store intelligence. She enjoys a good cup of tea and roller skating, but not at the same time.
Success Stories
Built. Scaled. Exited with Flippa
Hear from business owners and entrepreneurs who have bought and sold online businesses on Flippa.


Calculate your repayments and returns with Flippa’s seller financing tool.
Keep up with the latest from Flippa
Subscribe to our blog and get free tips, advice, and resources delivered directly to your inbox.
Need Help?
We understand that buying or selling a digital business isn’t easy. If you have any questions or require assistance, feel free to contact us anytime.
Contact Customer Support
Search our knowledge base for answers to common questions.